Fighting Climate Change During Your Commute
Oct 3, 2023
Growing up in New Brunswick, the main way I got around my city was by having my parents drive me. I took the bus to school and biked around my neighborhood as a kid, but beyond that small bubble, my mobility was reliant on access to a car. The occasional summer bike ride across town to my grandparents‘ house or to Canada Day festivities were special occasions that I look back on fondly.
By the time I was a teenager, I wanted nothing more than to get a driver’s license so I could finally move around where and when I wanted to. I got my license (along with all the costs associated with driving) and drove to school and work and got fast food whenever I felt like it. What I did not realize then and would learn as I moved through adulthood is that my inability to move around without a car was a symptom of the built environment that I grew up in.
The distances I wanted to travel were by and large very bikeable; they just were not designed for a bike. If I did want to go somewhere by bicycle, I was constantly told by my parents how unsafe it was (they still remind me!). I never really saw anyone biking as a form of transportation and not just for leisure, so I never really considered it as an option. This is what can be broadly described as car dependency.
Car dependency is a transportation system that prioritizes the needs of the private automobile over forms of movement like biking, walking, and public transportation. In a car dependent city, the needs of private automobiles dictate how roads and communities are designed. Features like wide roads with multiple lanes to enable fast moving traffic and large parking lots in front of buildings are emblematic of a car-oriented community.
All other road users such as cyclists, pedestrians, and public transit users are left with inadequate funding leading to underdeveloped infrastructure.
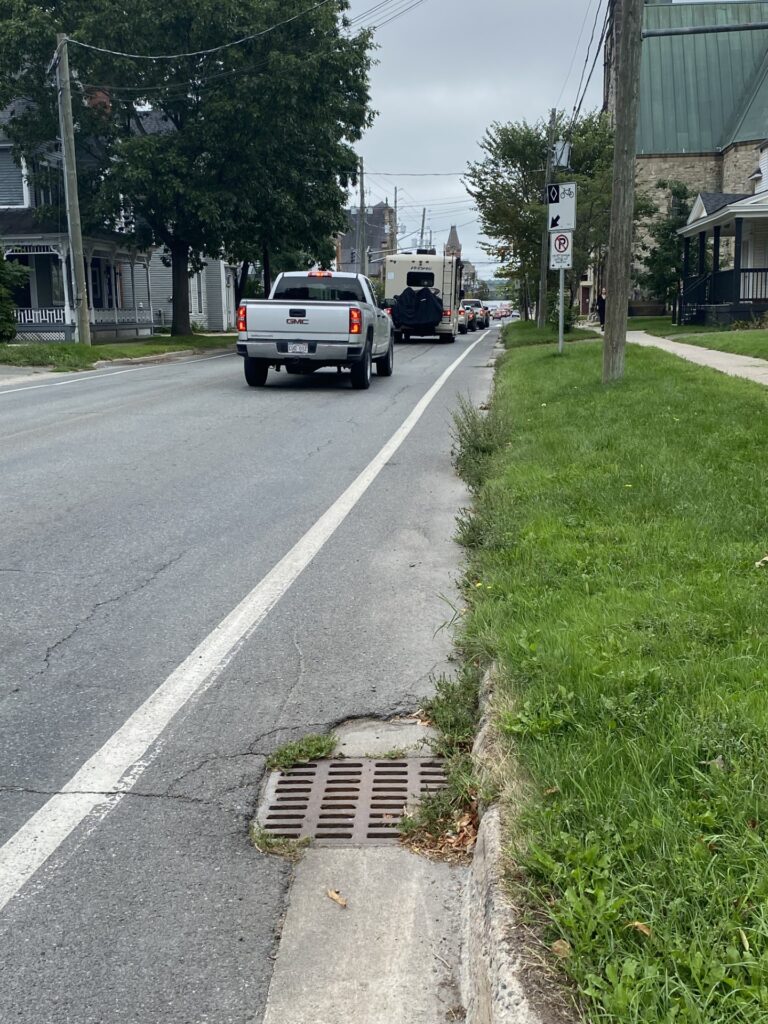
This painted bike lane is narrow, offers little protection, and is obstructed by a sewer grate and road damage. Fredericton, NB. Photo by Adam Mahoney.
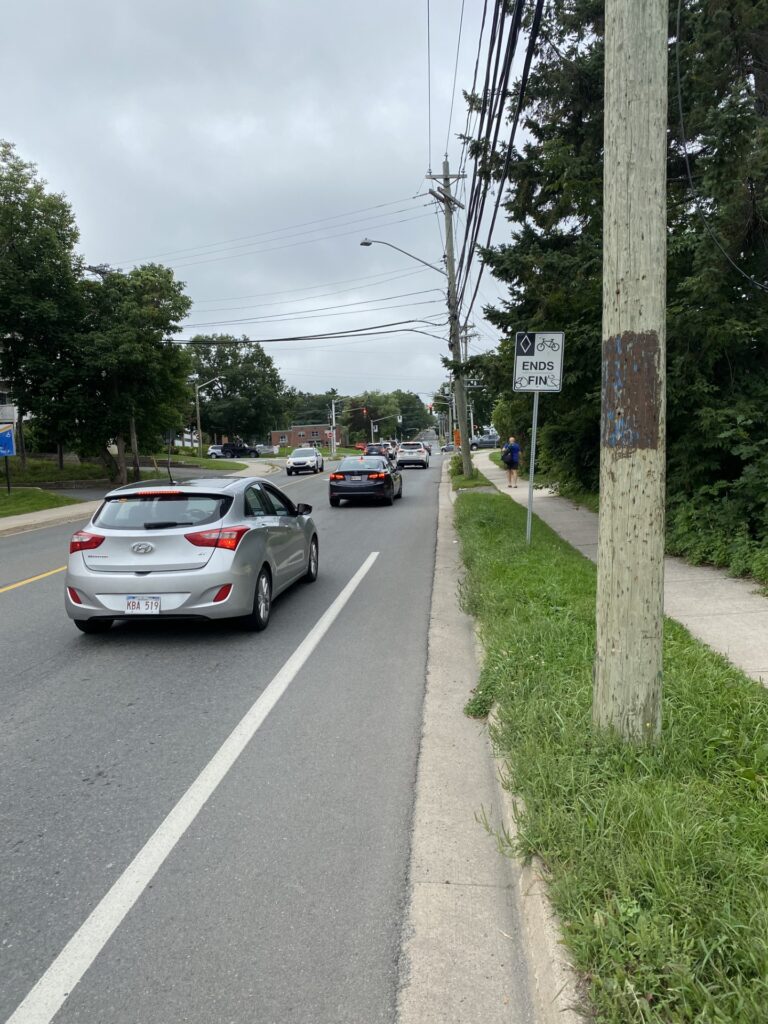
This bike lane abruptly ends, forcing cyclists to dangerously merge with car traffic at an intersection where there are the most conflict points with motor vehicles. York Street, Fredericton, NB. Photo by Adam Mahoney.
City streets end up feeling unsafe and unwelcoming for people who do not drive for whatever reason. The result is that around 9/10 trips taken in this province are by automobiles.
Climate impacts of our transportation system
This is problematic considering the transportation sector in New Brunswick contributes to 26% of overall CO2 emissions. At the national level, carbon emissions from the transportation sector increase steadily every year. From 1991 to 2019, national transportation emissions rose from just under 120 megatonnes to over 160 megatonnes (the years affected by the pandemic lockdowns saw reductions by about 20 megatonnes).
Canada ranks last in global vehicle fuel efficiency, consuming an average of 8.9 litres of gasoline per 100 kilometers. Compare that to the world leading Portugal who have an average fuel consumption of 4.9 l/100km. More fuel consumption equals more climate changing carbon emissions. The question is, why does Canada have the world’s worst fuel efficiency?
The answer, at least in part, lies in the fact that Canadians are buying vehicles that can be classified as Passenger – Light Trucks en masse. Emissions from passenger cars (sedans and hatchbacks) are decreasing – to the lowest point during the 30-year period but are being replaced and multiplied by Light Trucks.
Passenger – Light Trucks is a broad group of vehicles that generally consist of pick-up trucks and SUVs. The demand for these vehicles is high and increases every year. In 2020, 79.9% of all vehicles sold in Canada belonged to the “light truck” category.
The larger size and weight of these vehicles means they need more gasoline to move. New pickup trucks at the dealership in 2023 are not the same ones as in 1991. They are much bigger both in size and weight. The average truck today is 32% heavier (roughly 1,200 pounds) than in 1990. Consequently, the average truck emits 31% more CO2 than passenger cars, resulting in 156% emissions increase since 1991 – leading Canada to have the second worst per capita transportation carbon emissions, globally.
There are also road safety effects that need to be considered. People in Canada are buying larger vehicles because they feel and are safer in the event of a road collision. The opposite side to that, however, is that everyone not in a large vehicle is more unsafe – namely pedestrians and cyclists. In the United States (a country with a similar transportation system to Canada) has hit a 40-year high for pedestrian deaths with many people making the connection to larger vehicle sizes.
Two things stand out within our current transportation paradigm: we rely almost exclusively on private vehicles for the majority of trips; and those vehicles are much larger than they used to be, leading to an increase in CO2 emissions.
Solutions to car dependency
To lower our transportation emissions, there need to be adjustments in how we get from point A to point B.
Of course, the solution is not to stop driving altogether. A balance needs to be struck between different modes of transportation and to make “alternative” modes viable and safe. This might mean allocating some spending away from cars to bicycle infrastructure such as protected bike lanes and public transit, both within cities and for interregional transit.
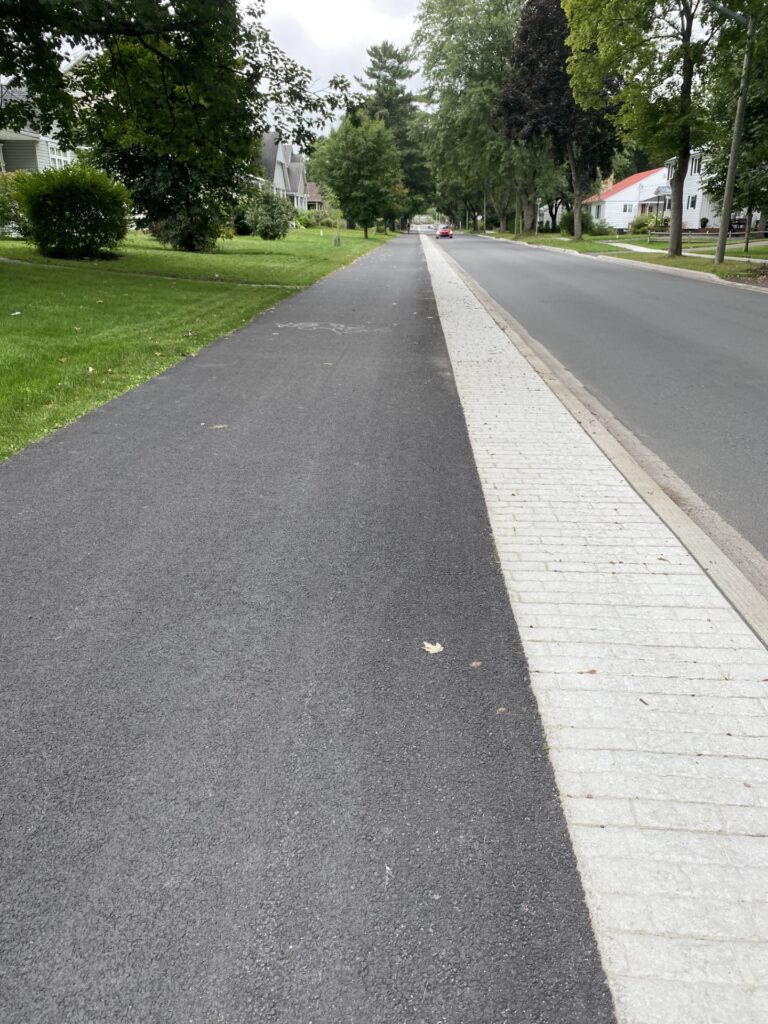
A fully grade separated, clear, and wide lane that eliminates potential interactions with motor vehicles. Fredericton, NB. Photo by Adam Mahoney.
The benefits of improving access to multiple transportation options are many. For one, every person on a bus or on a bike is one fewer person contributing to traffic. Bike lanes and public transit are more efficient at moving a lot of people than private vehicles. For the space of roughly 3 cars, a transit bus can hold up to 76 people while the average occupancy of a car is just 1.7 people (max 5-7 people) – the majority of cars on the road have just one person in them.
We don’t have Toronto traffic in our cities yet, but our roads will only become more congested as the population increases and our transportation system continues to depend on the private automobile.
The climate benefit of embracing more transportation options is a persuasive incentive. The CO2 emissions for the average private vehicle (all models) in Canada is 206 grams per kilometer. While big diesel buses emit a lot of carbon dioxide, accounting for the per person emissions for each individual on the bus, the impact is significantly lessened. For a bus that’s half full (35 people), the CO2 emissions for each person are approximately 60.48 g CO2/km and that number goes down the more people on the bus – or if it is electric!
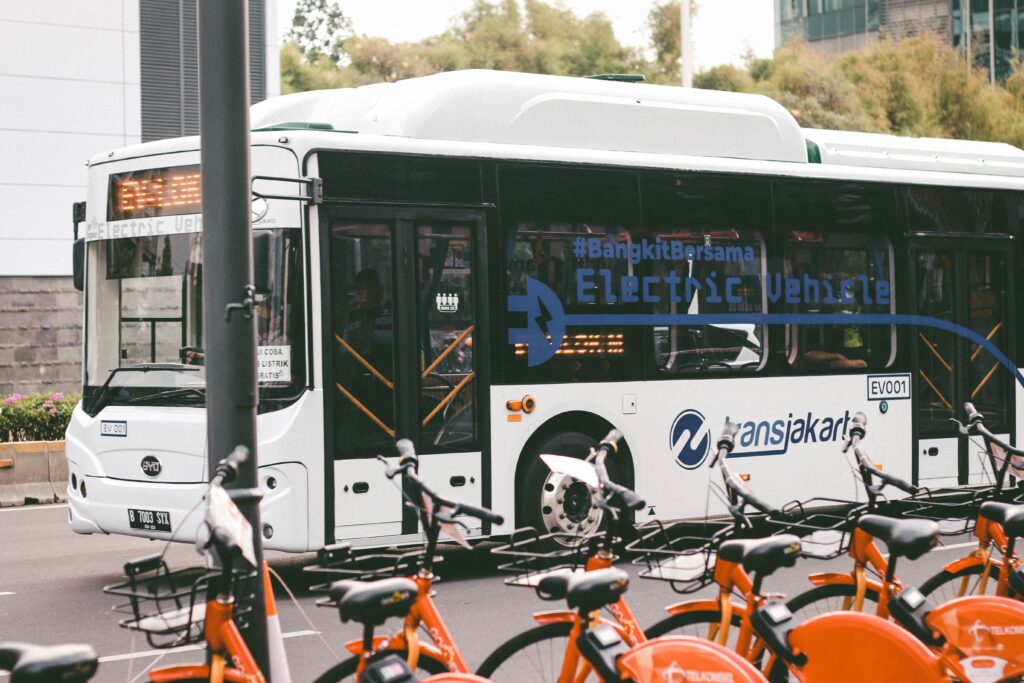
This is also where electric vehicles can make a big impact in lowering the carbon emissions for not just private vehicles, but also for public transit as well. Electric vehicles have significantly lower CO2 emissions than their gas counterparts and will only improve as the electricity grid eliminates carbon altogether.
A bicycle is even better, still, producing no tailpipe emissions and has comparatively small manufacturing emissions. The only thing that adds to the carbon footprint is from the food you eat! Moreso, the rise of E-bikes has dramatically increased the range and reduced barriers to participation for people interested in active travel. Plus, cycling (whether using a bicycle or E-bike) is a healthy and enjoyable way to get around!
@thegaiaproject_ Have you seen a more beautiful commute? Anna-Lee rode the Gaia Project e-bike from our HQ is downtown Fredericton to Nashwaaksis Bridge – that’s an 88km commute roundtrip! #LowCarbonTransportation #BikeTok #BikToWork E-Bike #ElectricVehicle . Aller travailler en toute beauté! Anna-Lee a pris le vélo électrique du Projet Gaia et s’est rendue de notre bureau, au centre-ville de Fredericton, jusqu’au pont de Nashwaaksis, soit 88 km aller-retour! #Transports #FaibleEmpreinteCarbone #VéloTok #AuBoulotÀVélo #VéloÉlectrique #VéhiculeÉlectrique
♬ Would That I (True that I saw her hair like the branch of a tree) – Hozier
Anna-Lee from The Gaia Project shares her journey home from work using the Gaia team’s E-bike!
If I had access to safe active transportation infrastructure growing up, I think I would have been less desperate to get a driver’s license as a teenager. Cities that build safe, integrated cycling infrastructure see a correlating increase in the number of people who use it.
We need to rethink the way we approach transportation in New Brunswick. A more sustainable transportation system would benefit everyone. Fewer people driving would lower provincial CO2 emissions, improve air quality, improve road congestion, and make streets safer for all road users. There is no one transportation solution, each mode can work together to create safer and more sustainable streets if they are given the space they need.
The Gaia Project’s new program, Sustainability in Motion, teaches high school students how our daily commutes contribute to climate change. They will learn how our transportation system favours emitting forms of movement and how we can make more sustainable choices in the future. Register for an in-class presentation from the Gaia Project and guided activities to help your students explore sustainable transportation!
References:
1. Hanson, R. Trevor, Allaire, Florence; MacEacheron, Carly. “Issues and Opportunities for Ehancing Active Transportation Among Rural and Urban Areas: Lessons from a New Brunswick Study,” UNB Department of Civil Engineering. October 2015. https://ctrf.ca/wp-content/uploads/2015/05/CTRF2015HansonAllaireMacEacheronTransportationPolicyPlanning.pdf
2. “Provincial and Territorial Energy Profiles – New Brunswick,” Canada Energy Regulator.Consulted on August 14, 2023. https://www.cer-rec.gc.ca/en/data-analysis/energy-markets/provincial-territorial-energy-profiles/provincial-territorial-energy-profiles-new-brunswick.html#:~:text=New%20Brunswick’s%20emissions%20per%20capita,23%25%20(Figure%207).
3. Environment and Climate Change Canada (2023) Canadian Environmental Sustainability Indicators: Greenhouse gas emissions. Consulted on August 14, 2023. https://www.canada.ca/en/environment-climate-change/services/environmental -indicators/greenhouse-gas-emissions.html#transport
4. “Market Snapshot: How does Canada rank in terms of vehicle fuel economy?” Canada Energy Regulator, 31 July. 2019. https://www.cer-rec.gc.ca/en/data-analysis/energy -markets/market-snapshots/2019/market-snapshot-how-does-canada-rank-in-terms -vehicle-fuel-economy.html
5. “The Rise of Light-Duty Trucks in Canada: Reversing the Trend,” Equiterre, 30 March. 2021. https://www.equiterre.org/en/articles/news-the-rise-of-light-duty-trucks-in-canada -reversing-the-trend
6. Tiseo, Ian. “Road transportation carbon dioxide emissions per capita worldwide in 2018, by select country,” Statista, July. 2020. https://www.statista.com/statistics/1201243/road -transport-sector-per-capita-co2-emissions-worldwide-by-country/
7. Chase, Will., Muller, Joann., Whalen, Jared. “How pickup trucks became so imposing,” Axios, 23 Jan. 2023. https://www.axios.com/2023/01/23/pickup-trucks-f150-size-weight-safety
8. Long, Zoe and Axsen, Jonn. “The rising Canadian Obsession with SUVs is disrupting out climate goals,” The Conversation, 19 Jan. 2023. https://theconversation.com/the-rising -canadian-obsession-with-suvs-is-disrupting-our-climate-goals-192822
9. Kim, Juliana. “U.S. pedestrian deaths reach a 40-year high,” NPR, 26 June. 2023. https://www.npr.org/2023/06/26/1184034017/us-pedestrian-deaths-high-traffic-car
10. Anderson, L. Michael and Auffhammer, Maximilian. “Pounds That Kill: The External Costs of Vehicle Weight,” The Review of Economic Studies, Volume 81, Issue 2, April 2014, Pages 535-571, https://academic.oup.com/restud/article-abstract/81/2/535/1517632? redirectedFrom=fulltext&login=false
11. Saxifrage, Barry. “Canadian cars are the world’s dirtiest,” National Observer, 4 Sept. 2019. https://www.nationalobserver.com/2019/09/04/analysis/canadian-cars-are-worlds -dirtiest-ev-age-essential
12. Mitra, Raktim., Khachatryan, Avet., Hess, M. Paul. “Do new urban and suburban cycling facilities encourage more bicycling?” Transportation Research Part D: Transport and Environment, Volume 97, August 2021. Pages 1-10. https://www.sciencedirect.com/science/article/pii/S1361920921002145
13. Newcombe, Daryl. “Critics say London, Ont.’s bike lanes are underutilized and seasonal – but here’s the ridership data.” CTV News, 26 May 2023. https://london.ctvnews.ca/critics -say-london-ont-s-bike-lanes-are-under-utilized-and-seasonal-but-here-s-the-ridership -data-1.6415256
Author: Adam Mahoney, Program Coordinator, The Gaia Project